
Situational Awareness for Novel Epidemic Response
1.0.1 - CI Build
![]()
Situational Awareness for Novel Epidemic Response
1.0.1 - CI Build
![]()
Situational Awareness for Novel Epidemic Response, published by HL7 International / Public Health. This guide is not an authorized publication; it is the continuous build for version 1.0.1 built by the FHIR (HL7® FHIR® Standard) CI Build. This version is based on the current content of https://github.com/HL7/fhir-saner/ and changes regularly. See the Directory of published versions
The Situational awareness for Novel Epidemic Response Implementation Guide enables transmission of high level situational awareness information from inpatient facilities to centralized data repositories to support the treatment of novel influenza-like illness.
The focus of this guide is to inform developers on how to create and use the essential FHIR Resources necessary to support national and regional reporting efforts on COVID-19 to public health officials. It describes how to exchange measures supporting situation awareness to enable appropriate response to healthcare emergencies affecting a population. While the immediate focus of this guide is in support of efforts to manage challenges related to the novel Coronavirus, the guide is informed by prior efforts supporting the exchange of situation awareness data in support of other emergencies (e.g., hurricanes, wild fires, mass injury events, et cetera).
Situational awareness has been the focus of attention in health IT circles well before the detection of potentially pandemic flu strains in 2005. Since then, a number of pandemics and other regional and national emergencies have emerged requiring some level of situational awareness to support responses by public health agencies.
Situational Data Needs of Public Health Key situational data needed by public health has remained relatively consistent and well established over this time, and is to support awareness of:
Situational awareness represents an understanding of what resources are available or needed, where, and when, so that decisions can be made about allocating resources where needed, or moving resources or those in need of them to the appropriate locations so that those resources can be used to support emergency response efforts. Resources can include just about anything that can be used to support the effort, food, medicine, supplies, people (with appropriate skills), equipment, utilities like water, power, et cetera. The key mechanism by which this guide supports situation awareness is through communication of measures related to essential elements of information needed to support emergency preparedness and response activities.
The purpose of situation awareness measures is to collect these essential elements of information (EEI) used to support emergency response. Briefly, EEIs are the data elements emergency response officials need in order to support critical decision making during an emergency. In the US, the Office of the Assistant Secretary of Preparedness and Response defines EEIs as:
- Essential Elements of Information (EEI)
- Essential elements of information are discrete types of reportable public health or healthcare-related incident-specific knowledge communicated or received concerning a particular fact or circumstance, preferably reported in a standardized manner or format, which assists in generating situational awareness for decision-making purposes. EEI are often coordinated and agreed upon pre-incident (and communicated to local partners) as part of information collection request templates and emergency response playbooks.
This is a healthcare focused definition of EEIs, rather than a more general definition of the term, but the term EEI is also used in other domains. A more detailed discussion of Essential Elements of Information addressing broader domain needs (including healthcare) can be found in Essential Elements of Information Publication Guidance published by the National Information Sharing Consortium.
In the ideal world:
EEIs will be well defined, understood, and implemented before a crisis occurs, but may need to evolve or be scaled as a crisis evolves and more is understood about the emerging situation.
Systems that have EEIs will be able to automatically collect and report them to organizations responsible for emergency response. Time spent manually collecting and reporting data that is not automated often suffers in quality.
New and changed EEI criteria can be automatically deployed, and those reporting systems can be rapidly updated to respond to changing information needs.
This implementation guide expands the uses for MeasureReport resource to report measures of situational awareness to state, local, territorial, regional, and national agencies, including but not limited to state and territorial public health agencies, regional agencies supporting public health or emergency preparedness and response, or national agencies such as the Centers for Disease Control (CDC) and the Federal Emergency Management Agency in the US.
For more than the last decade, HL7 and its members have been deeply involved in the evolution of measurement standards for clinical quality reporting, from early efforts in developing the HL7 Version 3 Health Quality Measure Format specification, to more recent efforts in the publication of the HL7 FHIR Quality Measure (QM), and the DaVinci Data Exchange For Quality Measures (DEQM) implementation guides. These guides provide excellent reference and background materials for those interested in learning more about the terminology used in measurement.
According to The American Heritage® Stedman’s Medical Dictionary:
measure v.
To ascertain the dimensions, quantity, or capacity of.
To mark, lay out, or establish dimensions for by measuring.
At its simplest, measurement is counting in units, and then doing some math with the resulting count or to obtain a value that lets you do something useful. The approach used in this guide is the counting of HL7 FHIR resources matching criteria associated to identify populations (of resources), and relate these populations in various ways to express a measurement. These measurements describe the capacity, availability, average service times, et cetera.
In late March of 2020, the CDC published a form and instructions for hospital reporting of bed and ventilator utilization, and FEMA provided a spreadsheet it expects to be emailed on a daily basis from in-hospital laboratory testing facilities. Examples of these documents are provided below.
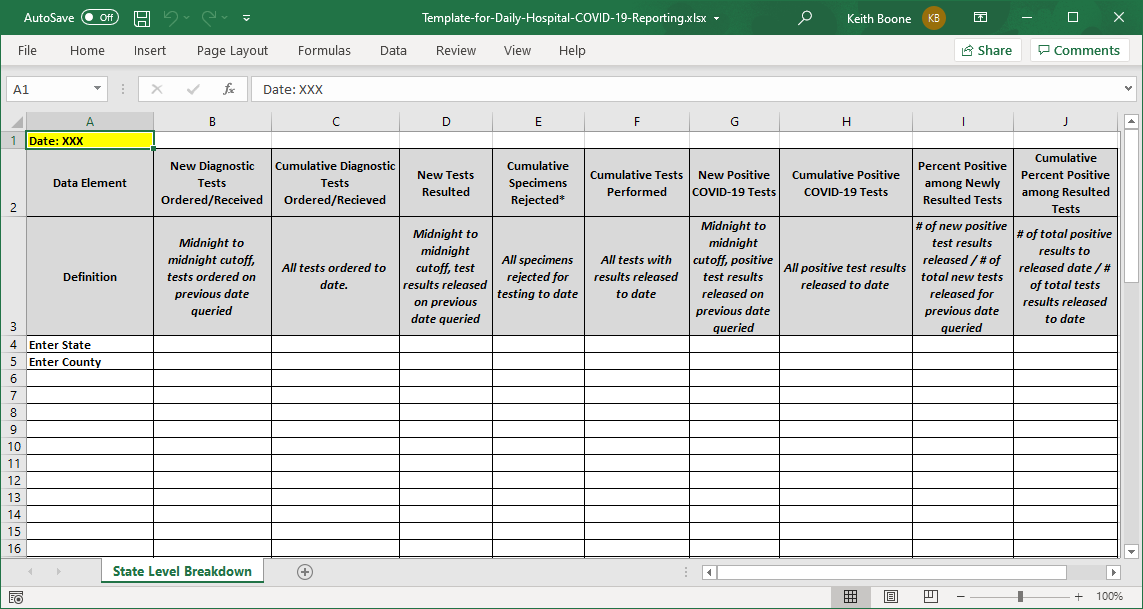 |
The approach of this IG to measurement is to capture all measurements reported to a single agency in a single FHIR MeasureReport resource, using multiple groups in the report for each kind of measurement reported. This approach is aligned with existing workflows associated with automated systems for receiving measure data. The approach very much treats the MeasureReport as if it were a report card (as one might receive from a school) describing how a location is doing on all measured criteria, with each group within the MeasureReport reflecting one of the “subject areas” being measured.
This is unlike typical workflows for clinical quality measurement, where measures are assessed one measure at a time, and is reflected in the current structure of the MeasureReport resource. There is some support in the MeasureReport to support composite measures reporting results from more than one measure. However, combining these subject areas into a single MeasureReport results in data loss when the separate measures in the composite use a different measure approach. This is due to the lack of an ability to express attributes of each Measured item at the group level within the Measure. That issue is addressed by this guide by creating an extension (see Measure Group Attributes) to allow topic, scoring and type to be shifted from Measure to Measure.group. To simplify interpretation of Measure by consumers, Measures created in this guide always include these extensions on Measure.group, even if they are not strictly needed.
Just as quality reporting defines several types of measures, situational awareness measures also follow several common patterns. Examining the data being captured for situational awareness during the COVID-19 crisis, this guide has identified the following types of measures:
These categories describe different ways of scoring of a measure and are included in the Public Health Measure Scoring coding system established by this guide.
A Capacity and Utilization measure describes the current capacity and utilization of fixed assets for treatment, and provides scores showing used and available capacity. It is a specialization of a Proportion Measure. The total system capacity is the denominator for the measure. There can be exclusions from the denominator to count resources that are temporarily unavailable for care for reasons other than being used for treatment. The utilization component is the numerator. It describes the number of units in use for treatment. The availability component is the numerator-complement which describes the number of units available for use. The measure score is computed as for a proportion measure.
The difference between is Proportion Measure and a Utilization measure is that in a proportion measure available capacity must be inferred, however, in a Utilization measure, the available capacity is directly reported in a measurement in the numerator-complement population of the measure. This implementation guide defines the code for the numerator-complement population.
In this way, the MeasureReport resource reporting utilization can be directly queried through FHIR APIs for available capacity to find a location capable of treating or caring for some number of patients (e.g., by available beds or ventilators at a facility or within a region).
A worked through example of capacity measure is provided in Measure Group Beds.
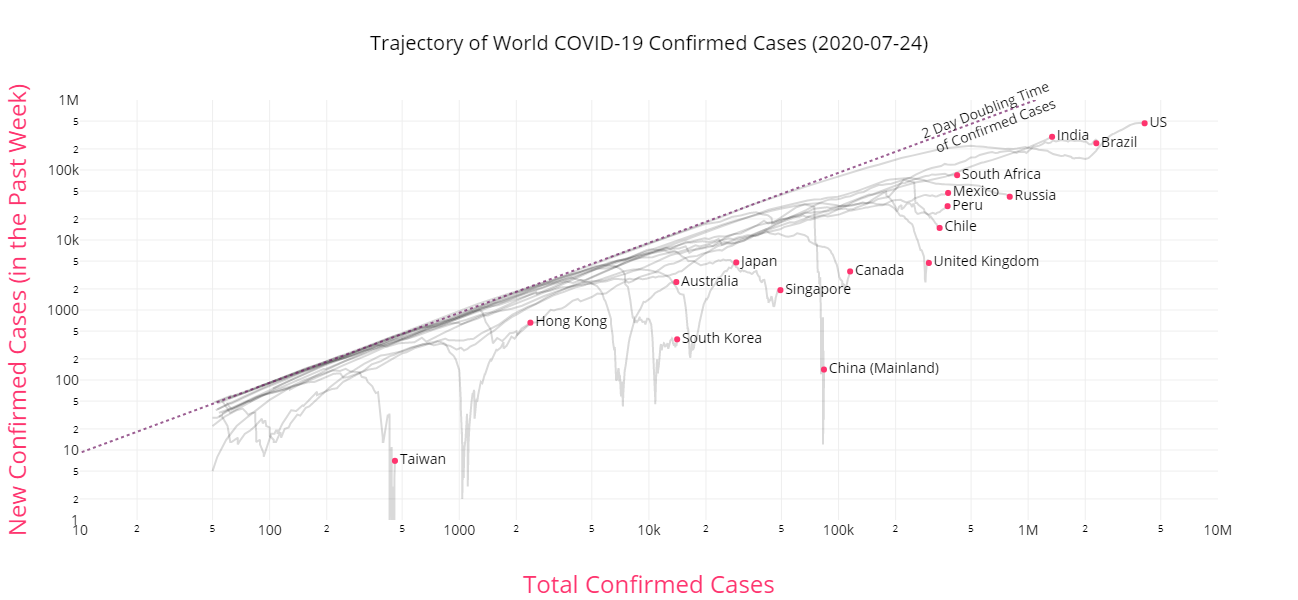
An event growth measure reports the number of events occurring during a time period (e.g., tests performed, positive test results, new cases) over the cumulative total of events (e.g., total tests performed, total positive results, or total cases) from some defined starting point. The numerator is the number events occurring during the period, and the denominator is the cumulative total of events. It represents the point in time rate of growth during the measure period of events of interest.
This is simply another form of Proportion measure, since what is being counted in the numerator and denominator come from the same initial population. A worked through example of an event growth measure is provided in Measure Group Covid-19 Deaths.
NOTE: The score for this measure group shall always range from 0 to 1, where 1 represents the highest rate of cumulative growth. If there were no prior event, the growth rate will be 1 in the first reporting period because the number of total events is the same as the number of new events. The number of total events never exceed the number of new events because they are counted at the same point in time (new events is part of total events). When the number of new events is 0, the measure score shall be reported as 0. Implementations failing to account for this may generate divide by zero exceptions, or attempt to report NaN (Not a Number) values, which can result in errors elsewhere.
The Covid Trends site demonstrates use of this measure in a graph to show the trajectory of confirmed cases. When plotted over time on a log-log scale, this kind of measure illustrates significant changes in events with exponential rates of growth. An example plot is shown below:
A Queue Length measure is a cohort measure which reports the number of activities awaiting completion (e.g., patients in an overflow area waiting for a bed, tests awaiting to be resulted, patients in a hospital awaiting discharge). Queue length usually represents a measure of an unmet need. Queue length measures can be improved to become service time measures by capturing the total time waiting for an completion of an activity, but this time may not be readily tracked, or queue length may be a sufficient signal of a problem that needs to be addressed. The benefit of service time measures is that they can be compared between facilities, whereas queue length is not readily comparable but may be more readily computable.
A worked through example of a queue length measure is provided in Measure Group Covid-19 Patients.
A Service Time measure is a specialization of the ratio measure which reports the total time taken to provide a service (e.g., wait times, length of stay, time to report a lab test result) for all events in the numerator, and the total number of events (e.g., services such as inpatient stays, tests performed) provided in the denominator. This is a ratio measure because the units differ in the numerator and denominator, where the events being counted in the numerator are essentially clock ticks in some unit (e.g., days, hours, minutes). The measure score is the average service time. These are generally process measures, describing the efficacy of the process being measured (e.g., treatment, testing).
Service time measures must report both the total number of events (the denominator) and the total time of service (the numerator) to support aggregation over time. Consider an organization reporting measures about time taken to produce test result, where one site results tests in 22.0 hours, and another site reports tests in 12.0 hours. The rate across both sites together cannot be computed if the number of tests is not reported. If the first site performed 100 tests, and the second performed 1000 tests, then the rate across both sites will be different if the quantities of tests performed is swapped. This is shown in the two tables below:
Case 1: Site 1 reports on 100 tests, Site 2 on 1000
| Site | Average Rate | Tests Performed | Total Time |
|---|---|---|---|
| 1 | 100 | 2,200 hrs | 22.0 hrs/result |
| 2 | 1000 | 12,000 hrs | 12.0 hrs/result |
| All | 1100 | 14,200 hrs | 12.9 hrs/result |
Case 2: Site 1 reports on 1000 tests, Site 2 on 100
| Site | Tests Performed | Total Time | Average Rate |
|---|---|---|---|
| 1 | 1000 | 22,000 hrs | 22.0 hrs/result |
| 2 | 100 | 1,200 hrs | 12.0 hrs/result |
| All | 1100 | 23,200 hrs | 21.1 hrs/result |
A worked through example of a service time measure is provided at the end of Measure Group Covid-19 Patients.
Availability measures are subtypes of cohort measures which enable tracking of availability of critical resources, generally consumables (e.g., PPE, medications, immunizations, oxygen, blood, IV fluids), or staff to support facility operations (e.g., physicians, nurses, other licensed providers, support and maintenance staff), or other resources (e.g., electricity, water) or available facility services (e.g., emergency department, helipad, burn unit).
These are generally categorical responses, typically in the form of a yes or no response to indicate availability or lack of availability. These are recorded in a similar manner to which categorical responses are encoded for stastical analysis, where a question that has one response that can be answered by selecting one of N values each value is turned into a separate question, with a yes or no answer, where yes is encoded using a value of 1 and no is encoded with a value of 0. For more complex questions with three or more categories, similar rules apply.
For example: PPE inventory quanties might be used to determine if a facility should be instituting conventional, contingent, or crisis optimization strategies and whether equivalent resupplies are readily available using the same mechanism for recording yes/no answers. If this were worded as a multiple choice question (allowing only one answer) in a questionnaire, a measurement instrument might ask:
What kind of resupply strategy is being used for N95 respirators: A) Conventional, B) Contingent, or C) Crisis Optimization
The measure would instead request individual count values for Conventional, Contingent or Crisis Optimization resupply strategy. A count of 1 would be assigned to the selected strategy, and a count of 0 to unselected strategies. This allows numerical analysis techniques to be used with categorical data.
A measure report for a single facility shall always have a value of 0 or 1 as the count for an availability measure. When unstratified, a 1 shall mean available, a 0 shall mean unavailable. When stratified the count for each stratum shall always be 1 or 0, where a 1 shall mean the facility meets the criteria for a specified stratum, and a 0 shall mean it does not. There shall be at most one stratum whose count is 1, and should be one stratum whose count is 1. The sum of values for all strata shall be 0 or 1.
A measure report aggregating over multiple facilities may have a value greater than one (the sum of all count values for all aggregated reports). The number “counts” the number of facilities for which the identified resource is available, or within strata, the number of facilities for which the stratification criteria were met.
A worked through example of a service time measure is provided at the end of Measure Group Ventilators.
In addition to initial population, denominator, denominator-exclusions and numerators, situational awareness measures may report other populations or population scores. Unlike quality measures, situational awareness measures do not use denominator exceptions. This implementation guide defines four additional types of populations:
These population types are defined in the Measure Populations code system.
The numerator complement is the quantity in the denominator that match neither the numerator nor the numerator-exclusion criteria. Summed together, the numerator, numerator-exclusion and numerator-complement must match the value of the denominator - denominator-exclusion value.
In a capacity and utilization measure, the numerator-complement population represents available capacity. By enabling reporting of available capacity in a measure report, the numerator-complement enables search for locations with available capacity meeting a specific criteria (e.g., an ICU with 10 open beds, or a hospital with 3 available ventilators).
Duration is a measure-observation provided with time units representing the duration of an activity or event (e.g. length of stay, time to admission, time for service).
Like Duration, duration-squared is a measure-observation. It represents the sum of squares duration of an activity or event. The sum of squares can be used to calculate other statistics, such as variance and standard deviation. Average and variance are the first two parameters that describe the shape of a distribution. Signal changes may first show up in sum of squares ahead of other statistics. This value can be used to support computation of variance in time of service measures. Increases in variation over time represent areas where service times are changing, and measures of variance allow for hypotheses testing about the distribution of measured events.
A supporting population represents an intermediate computation helpful in defining a measure, but not needing to be reported. It may be used to compute common groups of artifacts which are needed to report other populations.
Supporting populations should not be reported in production measures, but may be reported when testing or under other circumstances. A Measure Consumer that receives a report containing a supporting population should simply ignore or perhaps even discard it from the stored MeasureReport resource. These are like extra subtotals in spreadsheets, helpful for computing a final total, but not essential.
The table below illustrates the populations that are required for computing a situation awareness measure. Unlike quality measures, situation awareness measures do not require that an initial population be present for all measure types. It is permitted, and may be helpful in measure computation, but it is not essential for scoring or reporting.
| MeasureType | Initial Population |
Supporting Population |
Denominator | Denominator Exclusion |
Numerator | Numerator Exclusion |
Numerator Complement |
Duration | Duration Squared |
|---|---|---|---|---|---|---|---|---|---|
| Capacity and Utilization |
O | O | R | O | R | O | R | NP | NP |
| Event Growth | O | O | R | O | R | O | NP | NP | NP |
| Queue Length | O | O | R | O | NP | NP | NP | NP | NP |
| Service Time | O | O | R | O | NP | NP | NP | R | O |
| Categorical | O | O | R | O | R | O | R | NP | NP |
R - Required O - Optional NP - Not Permitted
Public health or other agencies may define a minimum set of values that are to be reported on, allowing facilities to omit entries in the measure that are either not applicable or not relevant for reporting. Thus, some measure values are required, and others are optional. This can be defined in the measure using the Measure Expectation extension in the Measure
A measure may contain sections for reporting that are either not appropriate or not applicable for all settings. In order to pass FHIR Validation, a MeasureReport that references a Measure must however, include all components of the measure. At the time of this publication, these constraints are hard coded into FHIR Validation tools, and are not generally available in computable form. When reporting these elements, the data-absent-reason extension can be used in the MeasureReport resource for these elements to indicate that they are not available.
To enable measure developers to specify which measure components are required, recommended or optional this IG defines the Measure Expectation extension. This extension operates identically to the expectation extension, but can be applied to Measure resources.
The Profiles and Extensions page enumerates the various profiles and extensions created for this guide.
IG © 2020+ HL7 International / Public Health. Package hl7.fhir.uv.saner#1.0.1 based on FHIR 4.0.1. Generated 2024-05-18
Links: Table of Contents |
QA Report
| Version History |
 |
Propose a change
|
Propose a change